Project on GitHub Flipper App Catalog
Have you heard that sitting behind a window protects you from sunburn? Sounds good, right? Unless you dig a bit deeper and realize it’s only kind of true. Sure, windows typically block some UV-B (the type of ultraviolet radiation that causes immediate sunburn), but a lot of UV-A could still get through. And guess what? UV-A plays a role in developing melanoma, a deadly form of skin cancer. Suddenly, this sense of safety behind glass feels rather deceptive: you lose that immediate “sunburn feedback” yet remain exposed to long-term risk.
And that's not even the whole story. It depends on the type of window glass and possible treatments it has undergone; I've also heard some car windows might offer better protection than regular ones. At this point, things seem even less predictable, with more questions popping up. Do my sunglasses really block UV radiation? Does my shirt actually protect me? How bad is it really in the shade or on a cloudy day?
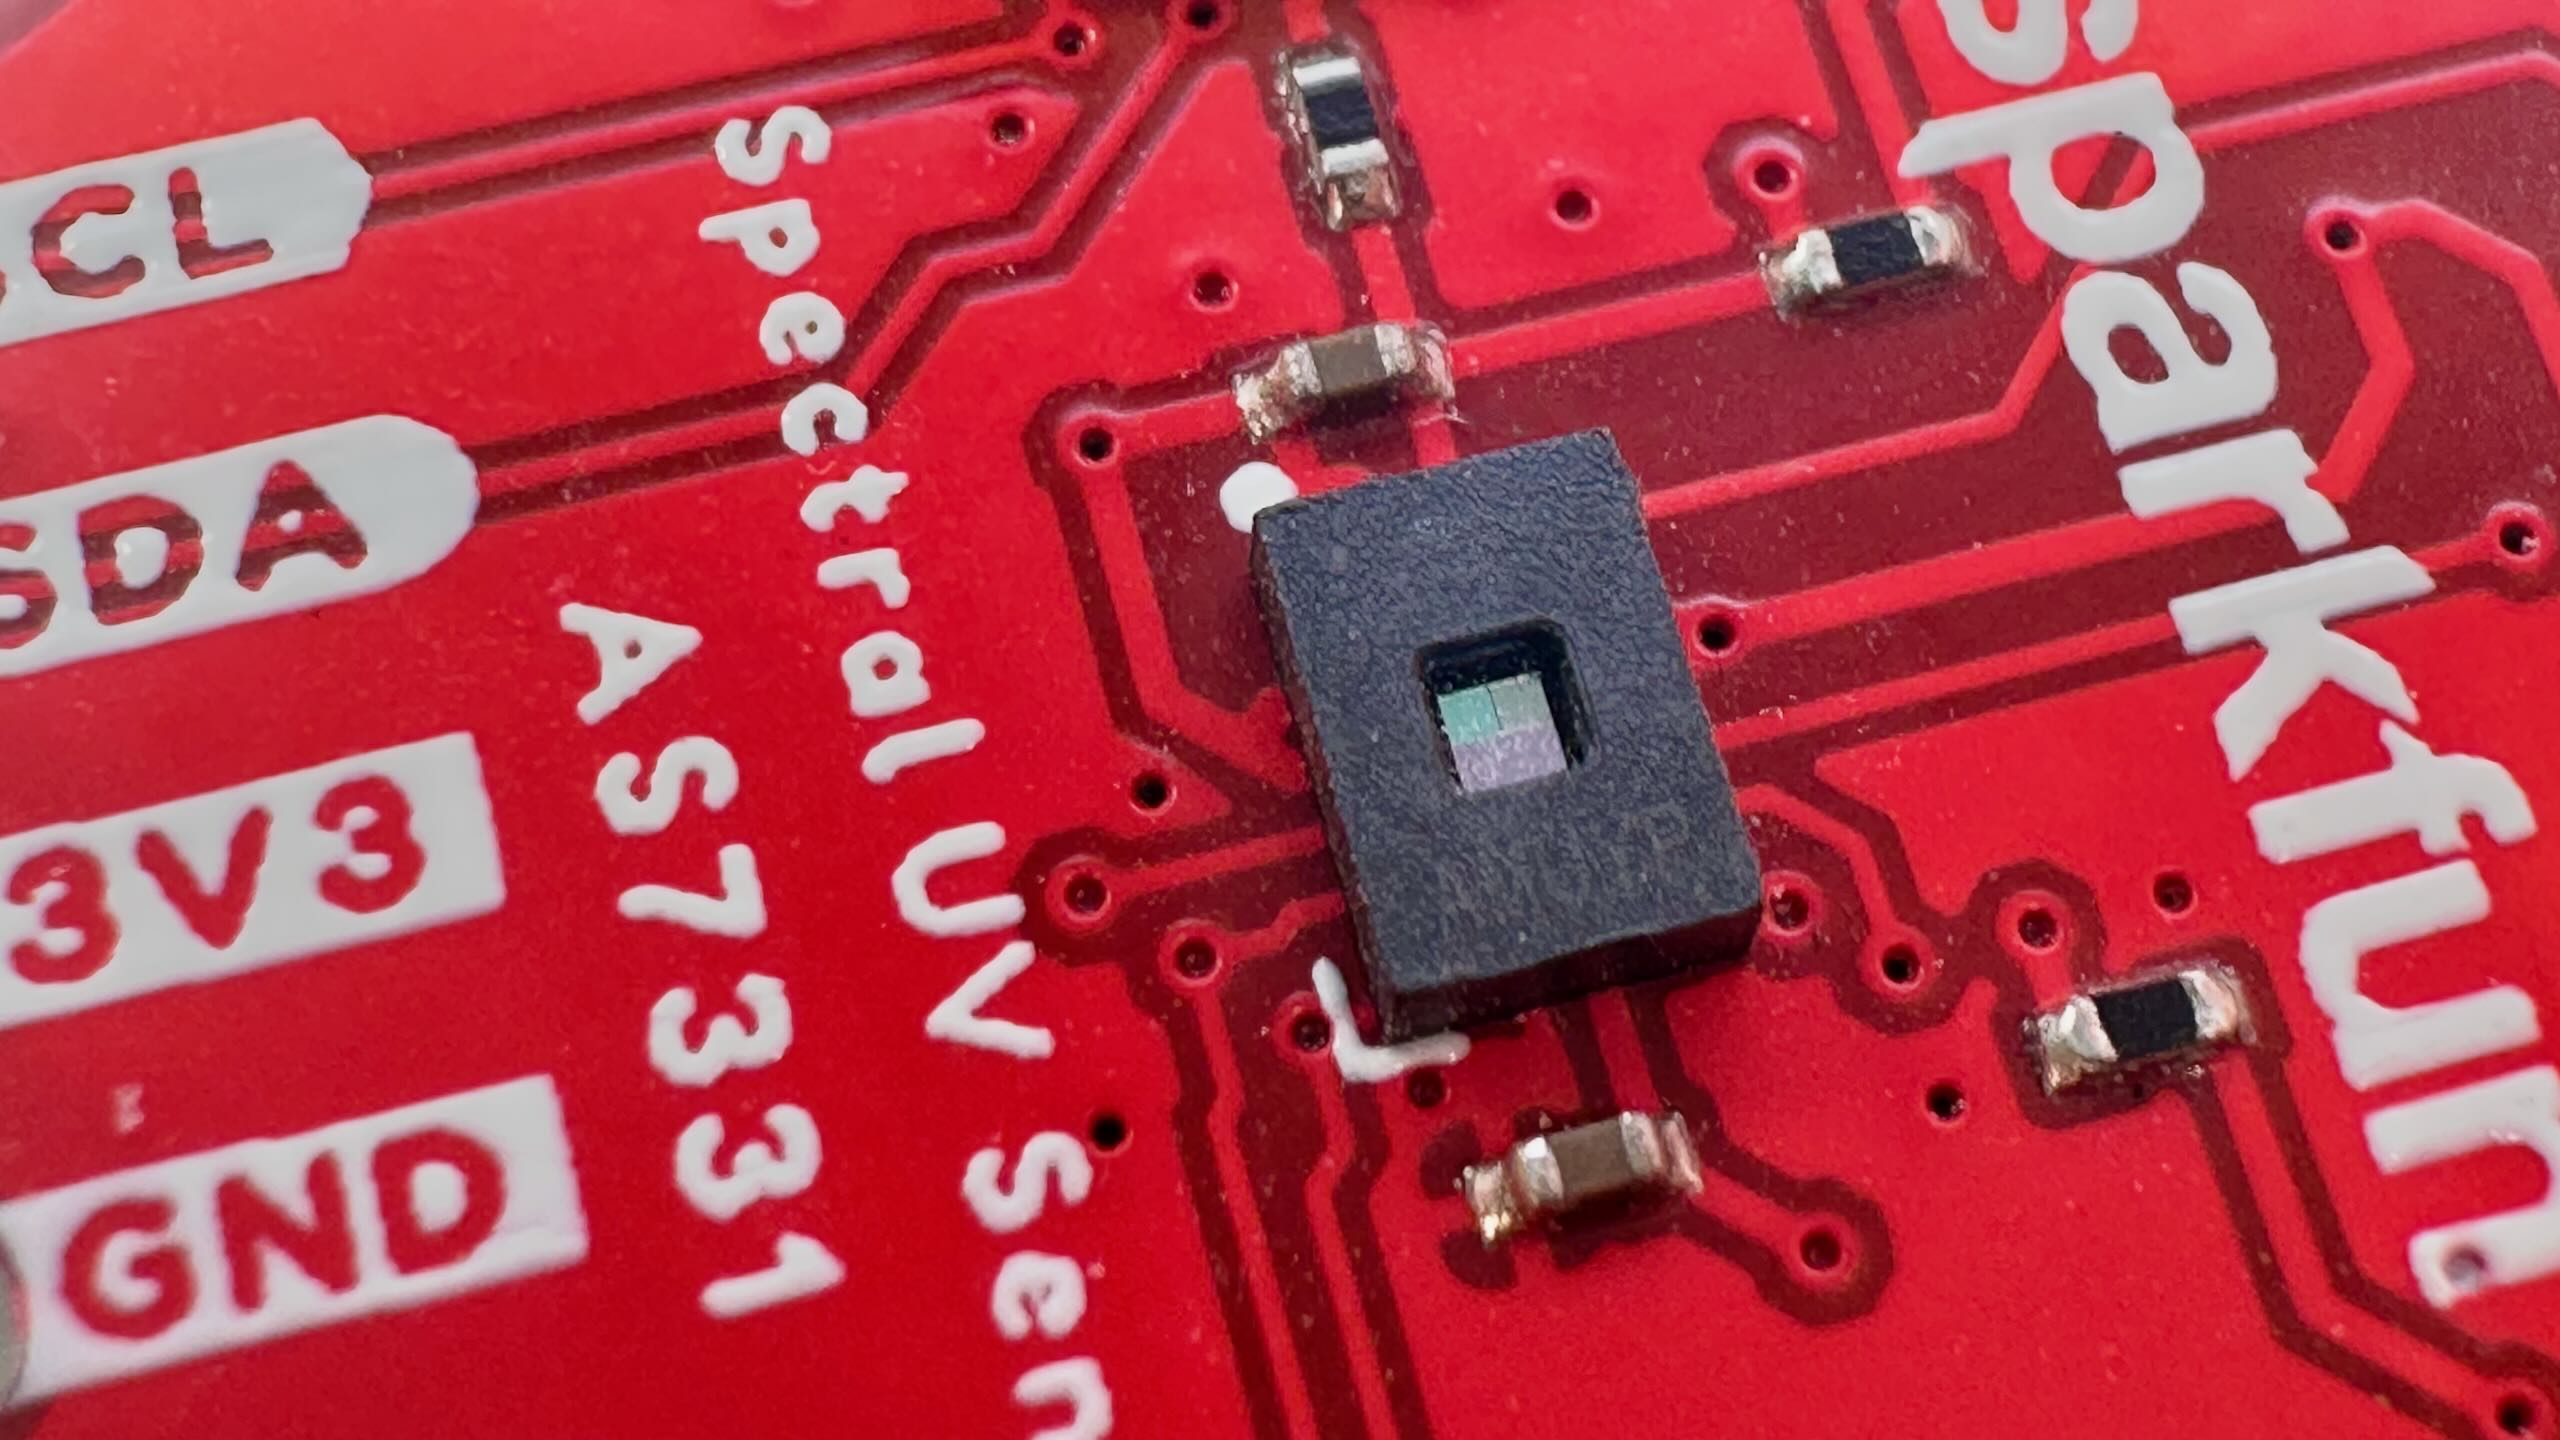
What we need is data. Being able to actually measure something can be surprisingly empowering. When I discovered the AS7331 sensor — capable of independently measuring UV-A, UV-B and UV-C — the idea for this project was born.
Flipper Zero Application
The Flipper Zero quickly became the obvious choice to pair with this sensor. The Flipper is portable, has a built-in screen and some buttons, and importantly, it has GPIO pins to interface with the sensor. Plus, the community has already built other sensor-driven applications. And for me personally, it sounded like an interesting opportunity to learn a lot.
The Sensor
Initially, I started from a basic Flipper I²C tutorial and the SparkFun AS7331 Arduino library. But as development progressed, nearly nothing from that original code remained.
Talking to the sensor via I²C turned out to be far more involved than I anticipated. You might imagine you could simply ask the sensor nicely for data and display what was returned — but no. You have to manually manage the sensor's operating modes (Config, Measure, and additionally Standby), select the measurement mode (continuous, command-based, or synchronous), and choose appropriate values for settings like Gain, Integration Time, and Divider. Additionally, the raw data returned by the sensor isn't directly useful; it requires several calculations factoring in sensor settings, clock frequency, and hardcoded values from the datasheet. Only after that do you obtain meaningful measurements in µW/cm². I could go into much more detail, but I think you get the idea.
After combing through the datasheet and pouring my understanding into code, I ended up with my own AS7331 library, which I'm quite happy with.
What Do These Values Actually Mean?
Congratulations — you've retrieved UV readings (µW/cm²) for UV-A, UV-B, and UV-C. But the immediate next question arises: how dangerous are these values? Should I worry about the UV-A exposure, given that it's usually much higher compared to UV-B and UV-C?
Finding good guidelines that answer these questions was another rabbit hole. I eventually settled on the Threshold Limit Values (TLVs) and Biological Exposure Indices (BEIs) from the American Conference of Governmental Industrial Hygienists (ACGIH). They primarily focus on workplace safety, while noting their limits aren't sharp boundaries between safety and danger. Nevertheless, I think they can be useful as general indicators of UV exposure risks.
ACGIH defines a daily UV exposure limit (0.003 J/cm²) and provides a table of “Relative Spectral Effectiveness” because not all UV wavelengths affect humans equally. However, applying this table wasn’t straightforward, as it lists effectiveness values every 5 nm, while I have just three broad UV ranges from the sensor. I documented my entire process of deriving an average “Effective Irradiance” here. In short, I merged the sensor's normalized responsivity curves (Resp[UVX]) with the “Relative Spectral Effectiveness” values (SpecEff) to compute a “Weighted Spectral Effectiveness” — essentially a weighted arithmetic mean:
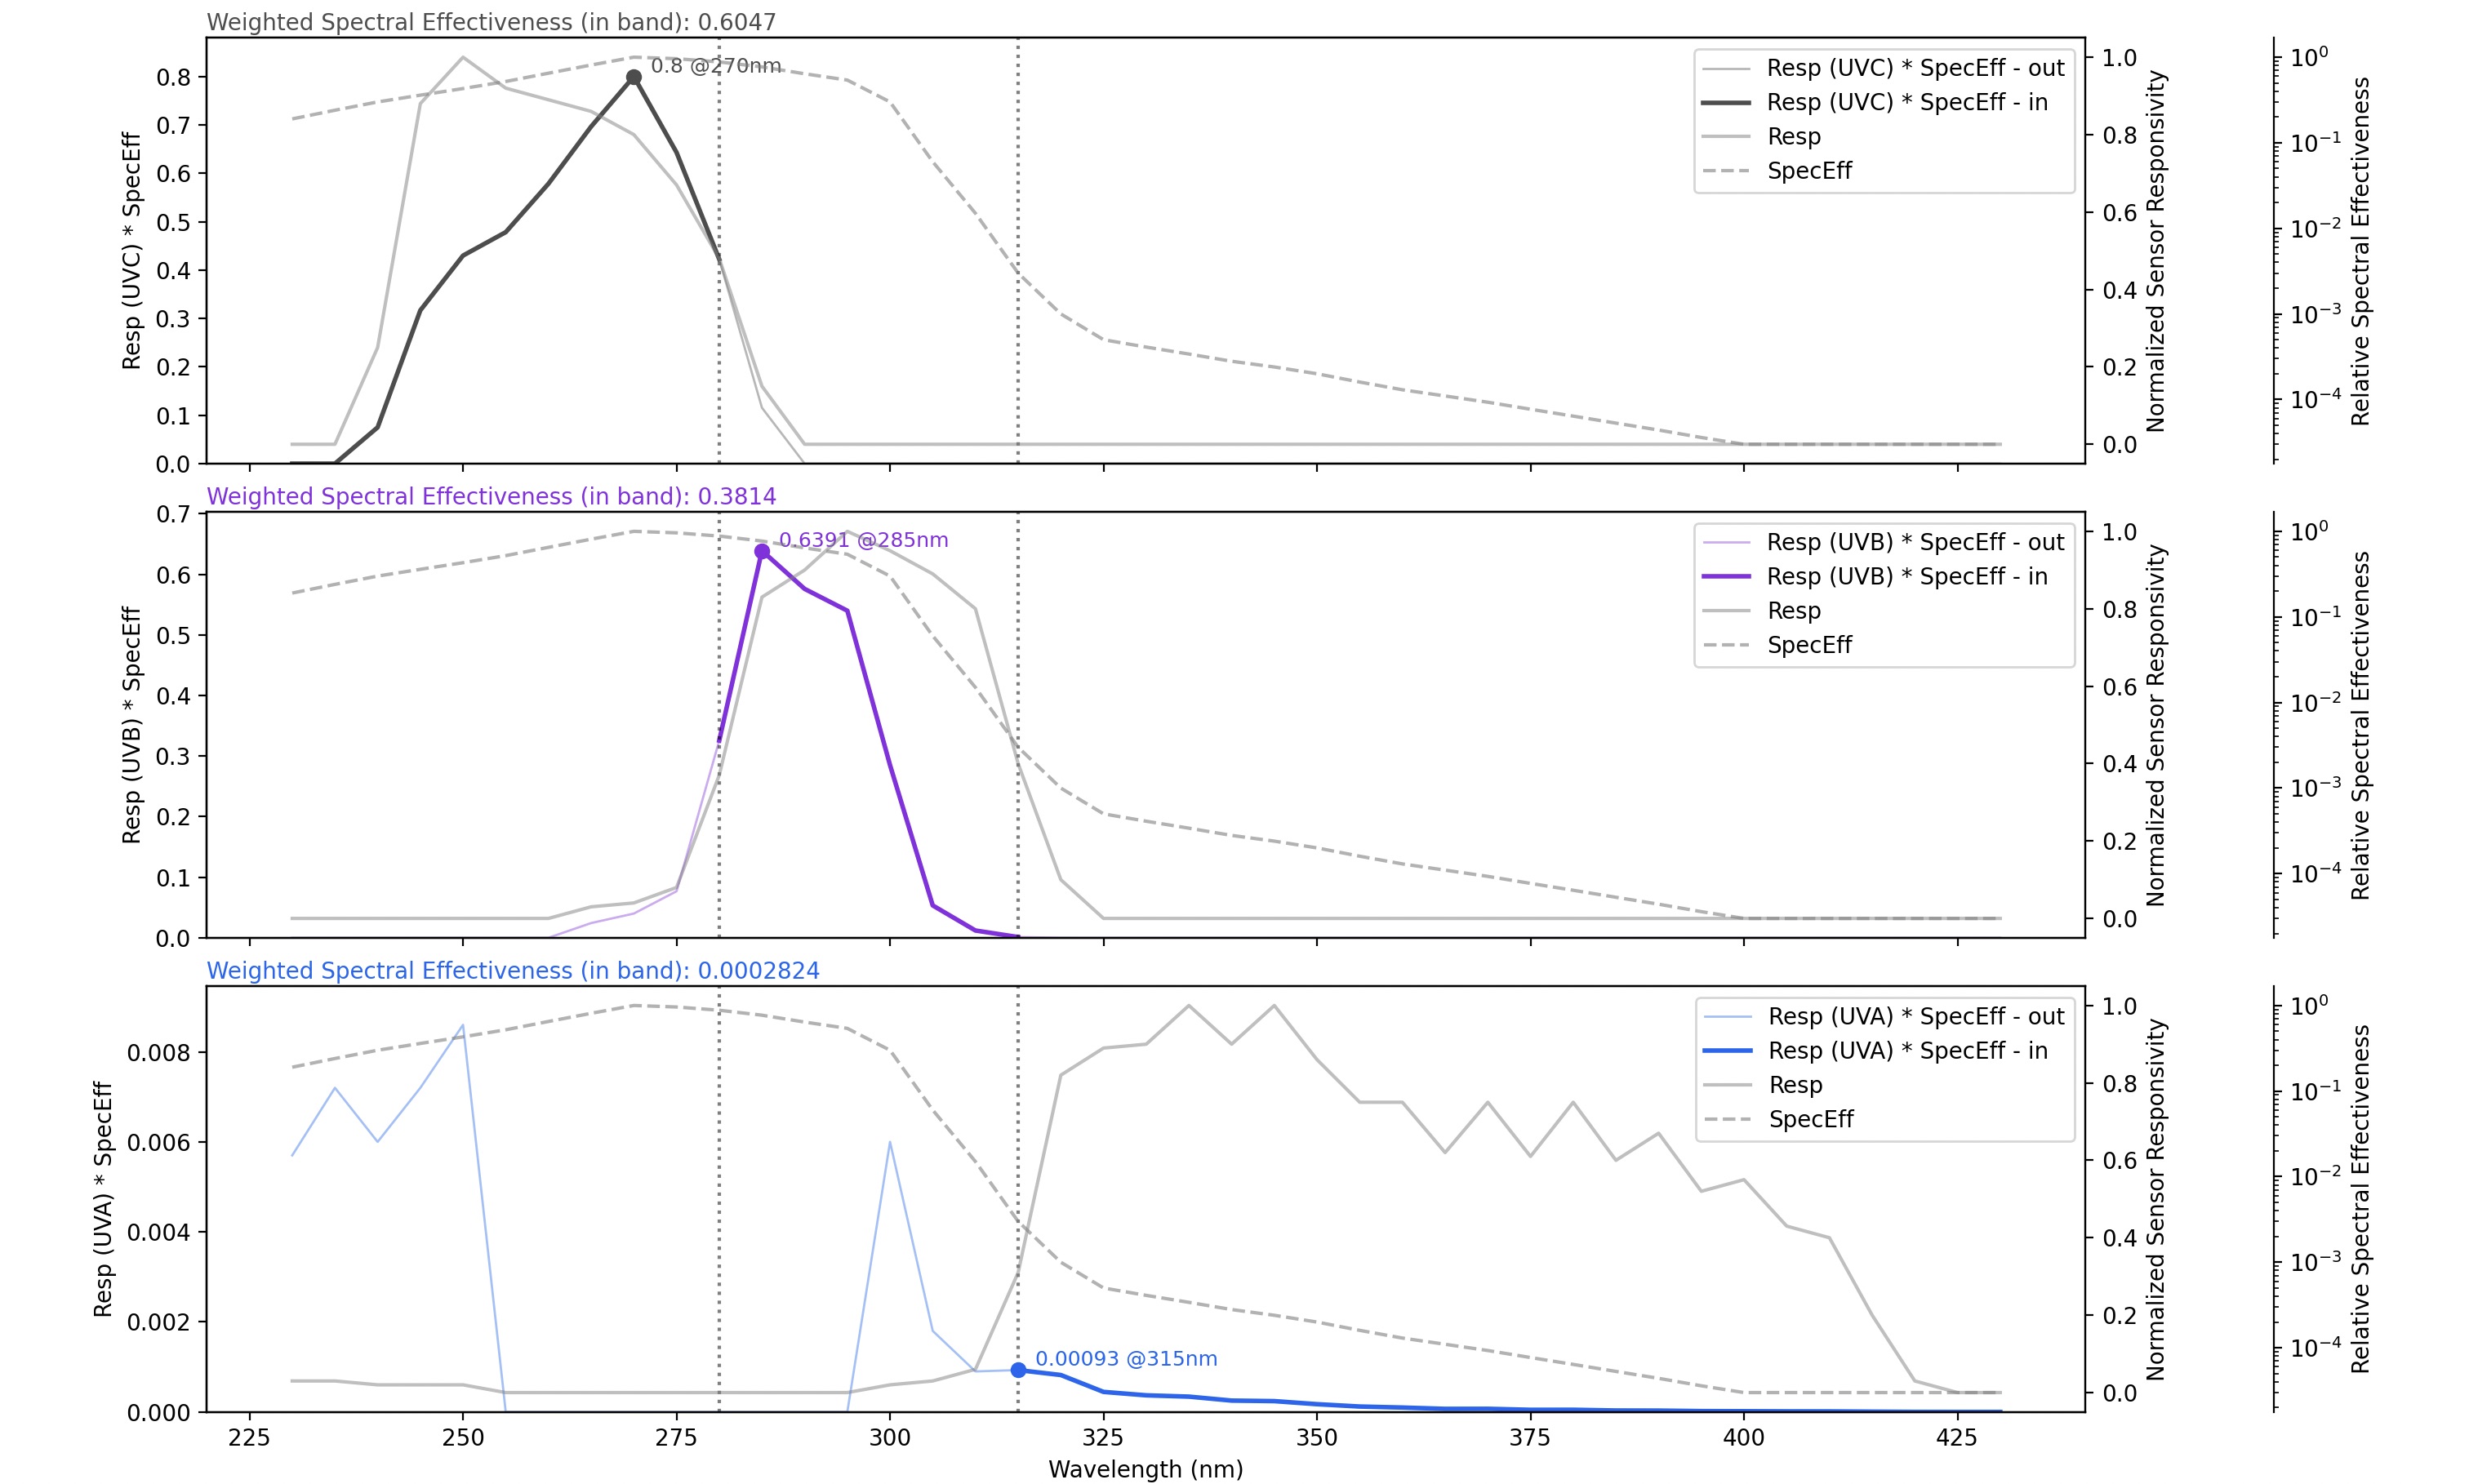
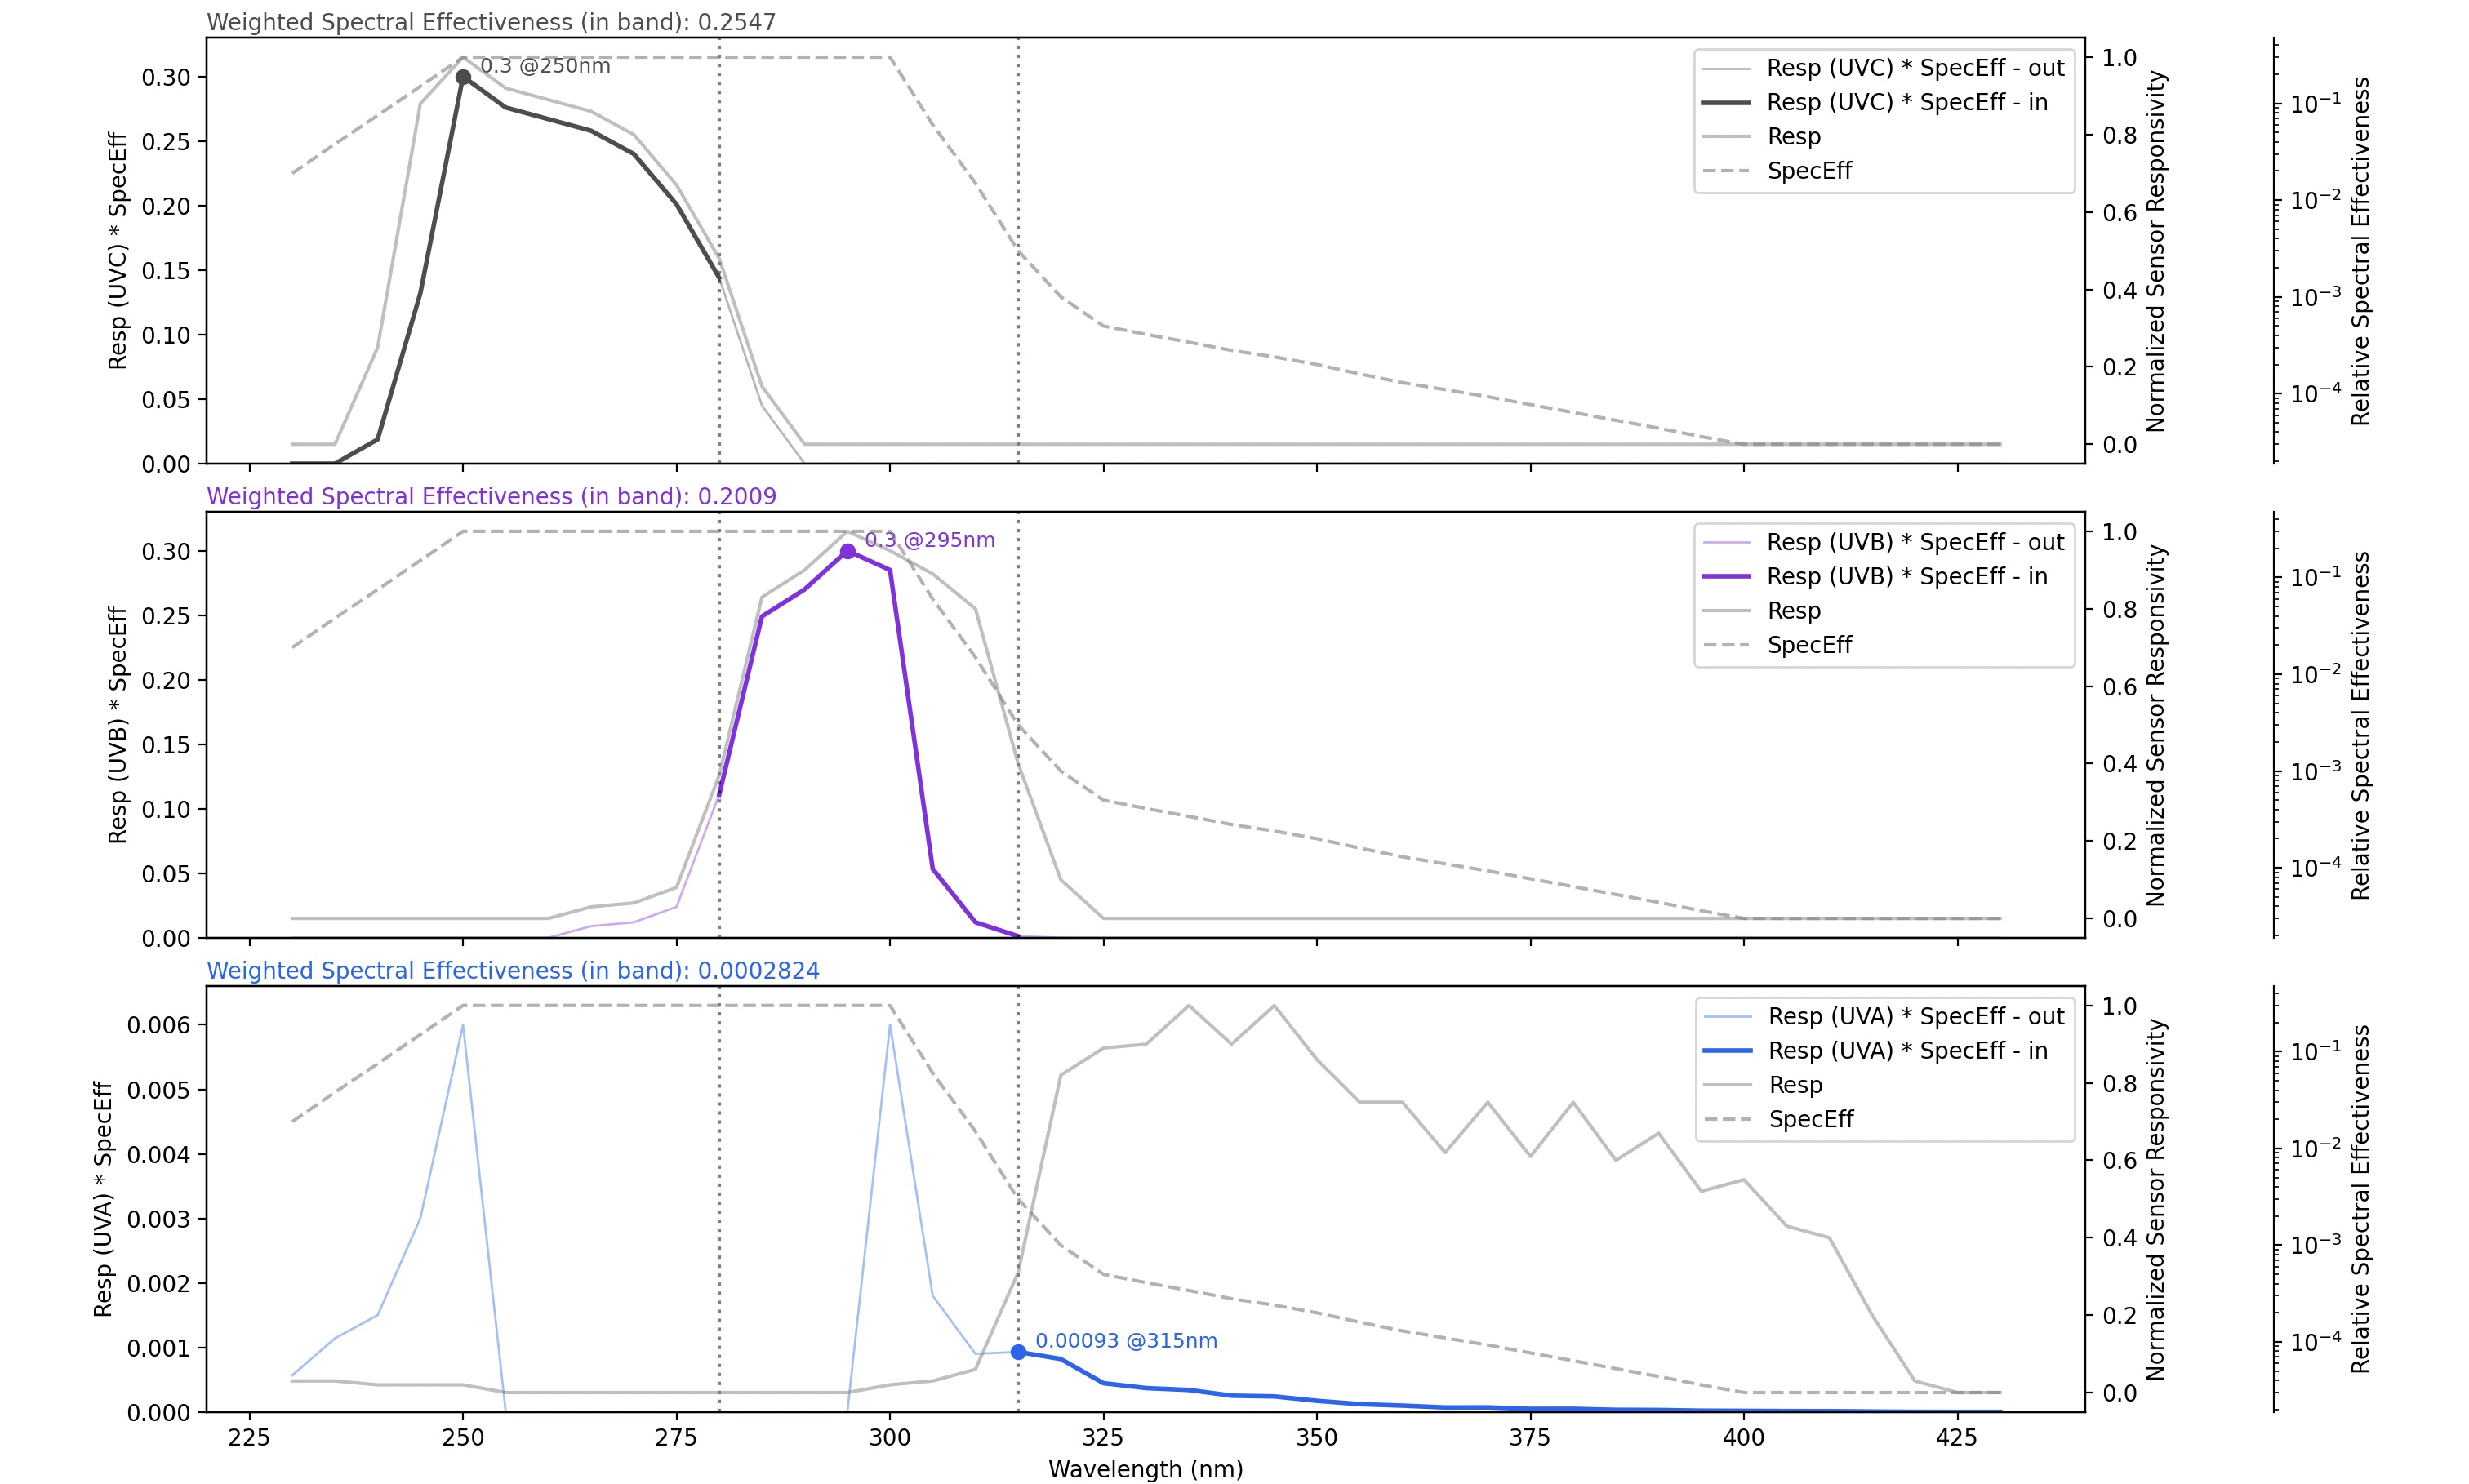
Ultimately, I ended up with two sets of conversion values (one for eyes protected and one without), enabling me to translate raw UV readings into a single metric: the maximum daily exposure duration. Finally, a number that should quantify the risk of a given measurement.
The User Interface
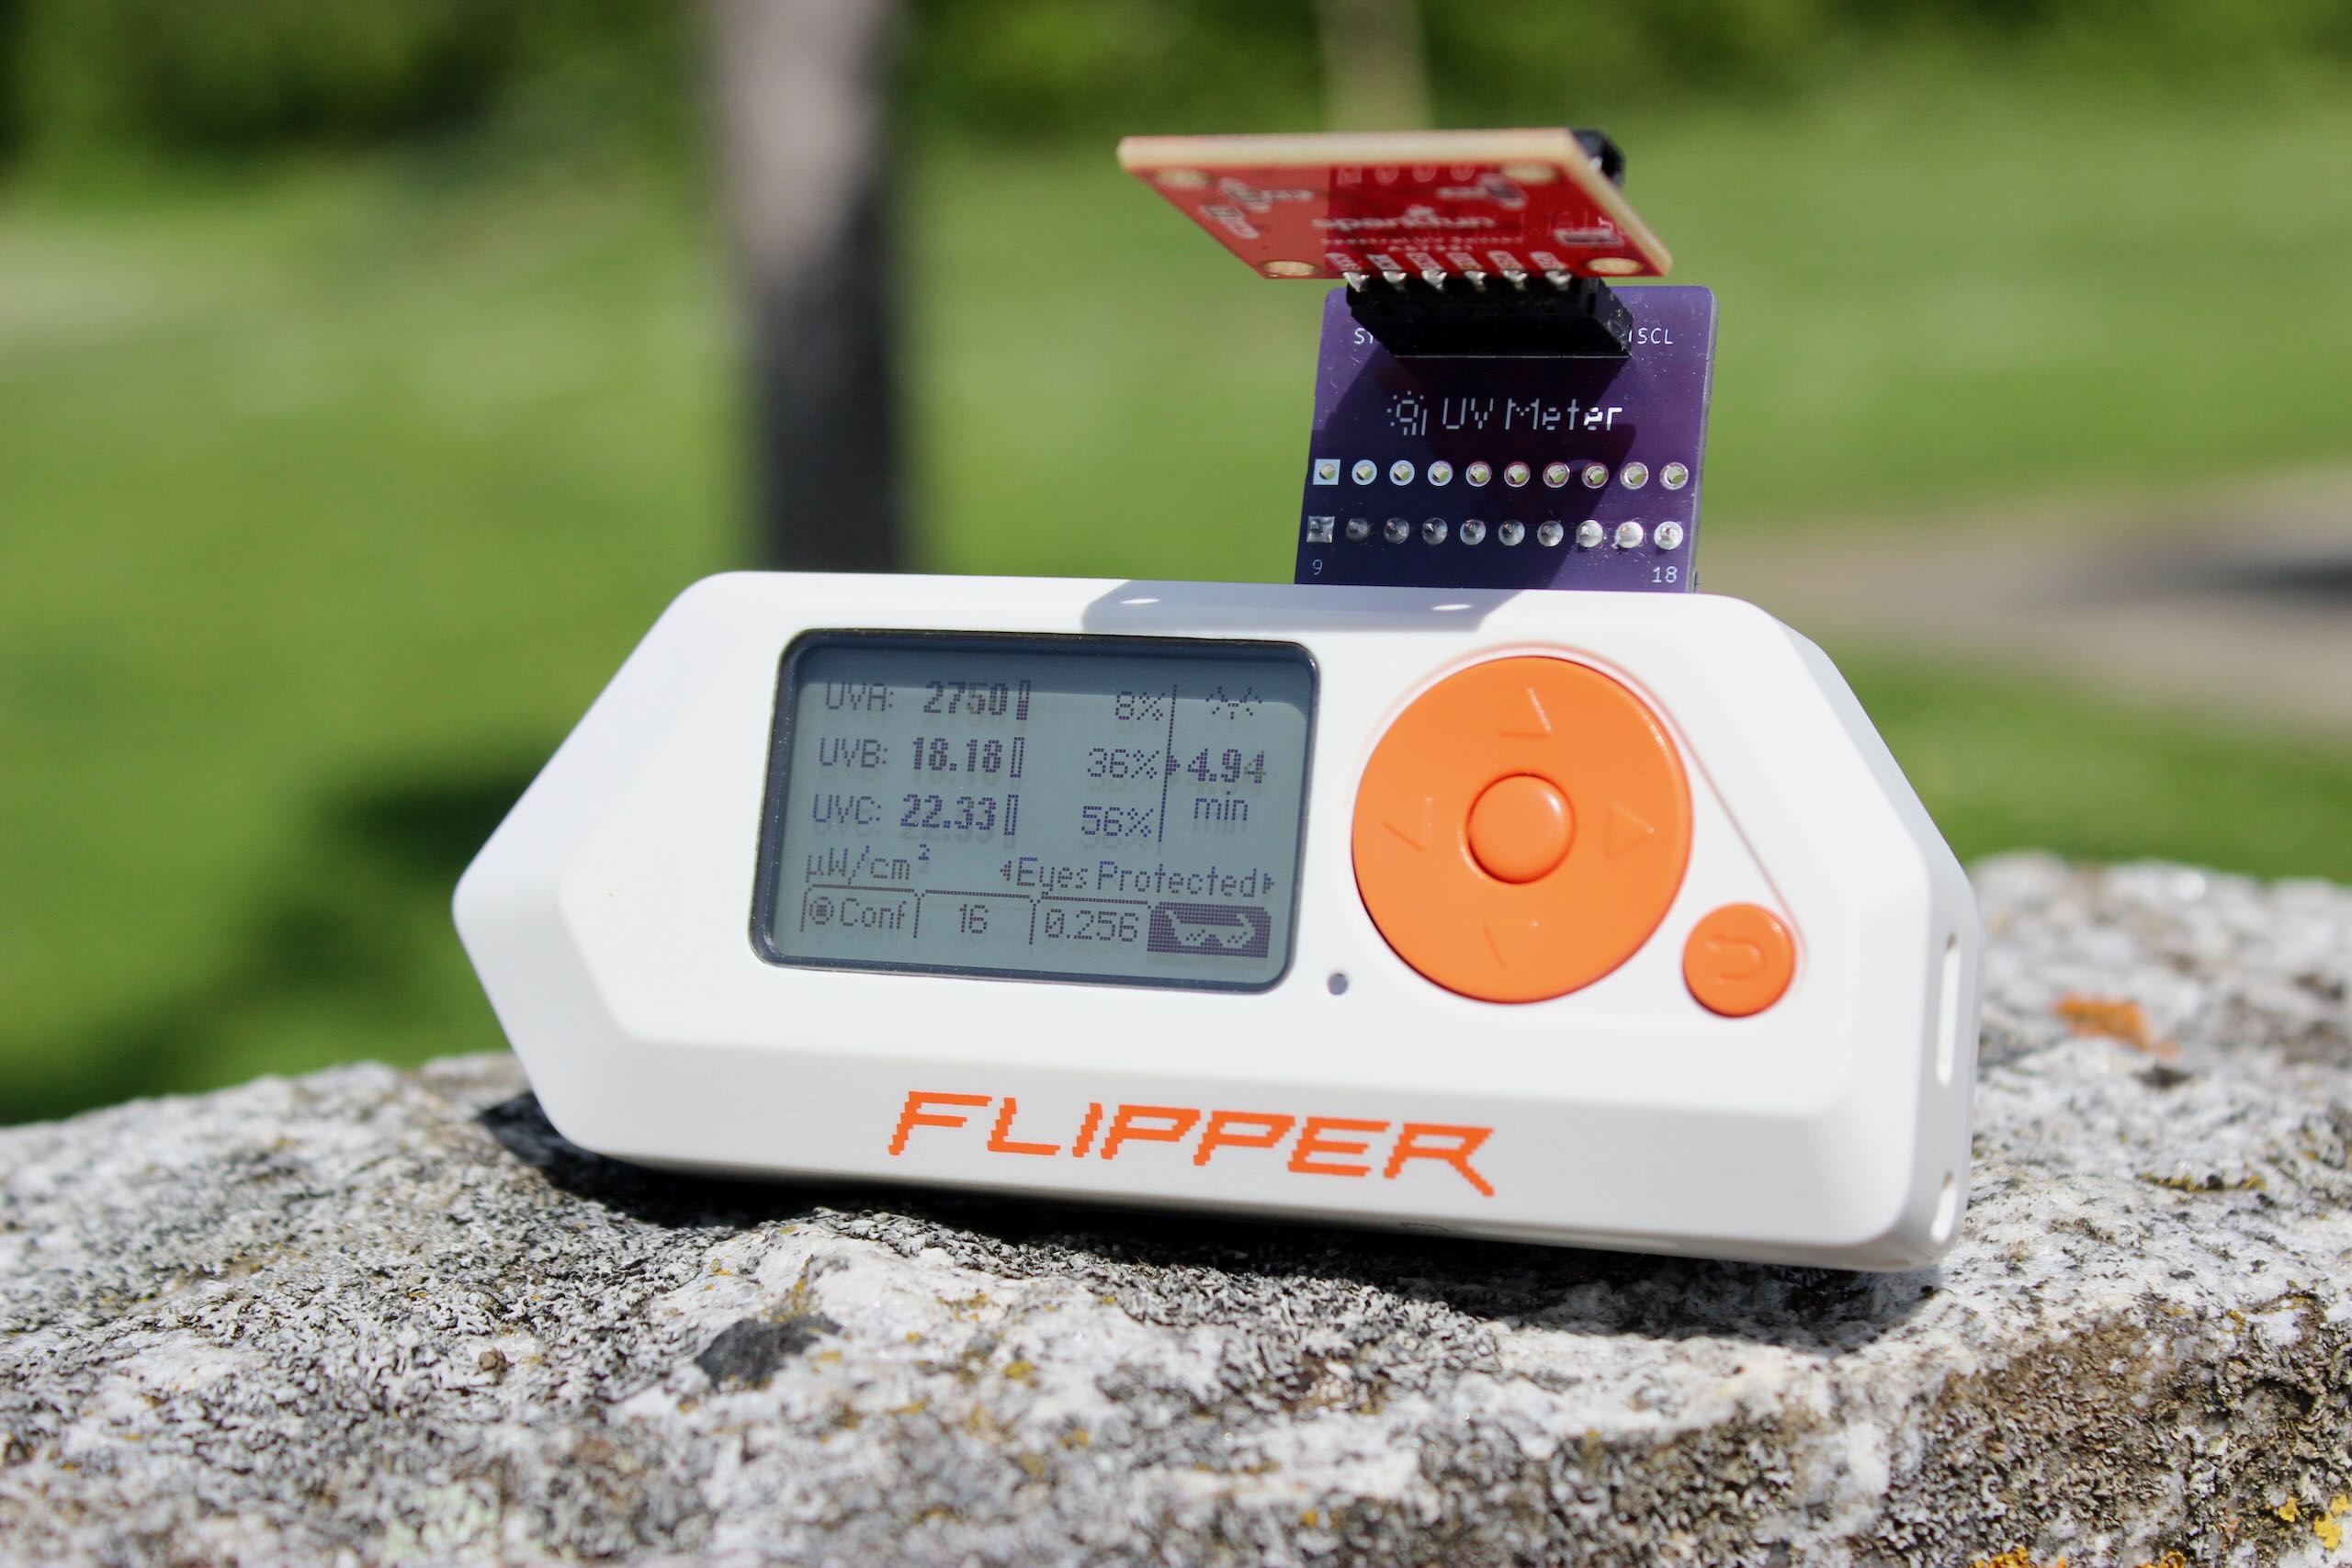
Simply displaying sensor values was alright during development, until I knew everything would work properly. But once I understood how to handle the sensor and exactly what information I wanted to display, I decided it was time for a proper user interface. Showing the UV readings and the “maximum daily exposure duration” is obvious, but there’s more — something we haven’t yet discussed: the overflows.
Earlier, I mentioned the “raw values” returned from the sensor. These values can only range from 0 to 216. Depending on your settings, you can easily hit this upper limit for UV-A if the sensor is pointed at the sun. Conversely, readings become imprecise as you approach zero. To ensure reliable readings, we must avoid both scenarios, similarly to how we prevent over- or underexposure in photography by adjusting the Gain and Exposure Time settings (analogous to ISO and shutter speed). This means, while using the application, it’s also important to have a rough idea of the raw values and an easy way to adjust Gain and Exposure Time.
The Flipper Zero's monochrome screen resolution isn't very large, only 128×64 pixels. Typically, applications with settings like these require opening a separate settings menu, making adjustments, and then returning. However, this approach felt inconvenient here — I wanted immediate feedback on how changing Gain or Exposure Time affects the raw values (similar to using a digital camera). But having all these elements on one small screen meant things could get pretty crowded, so I spent some time figuring out possible solutions.
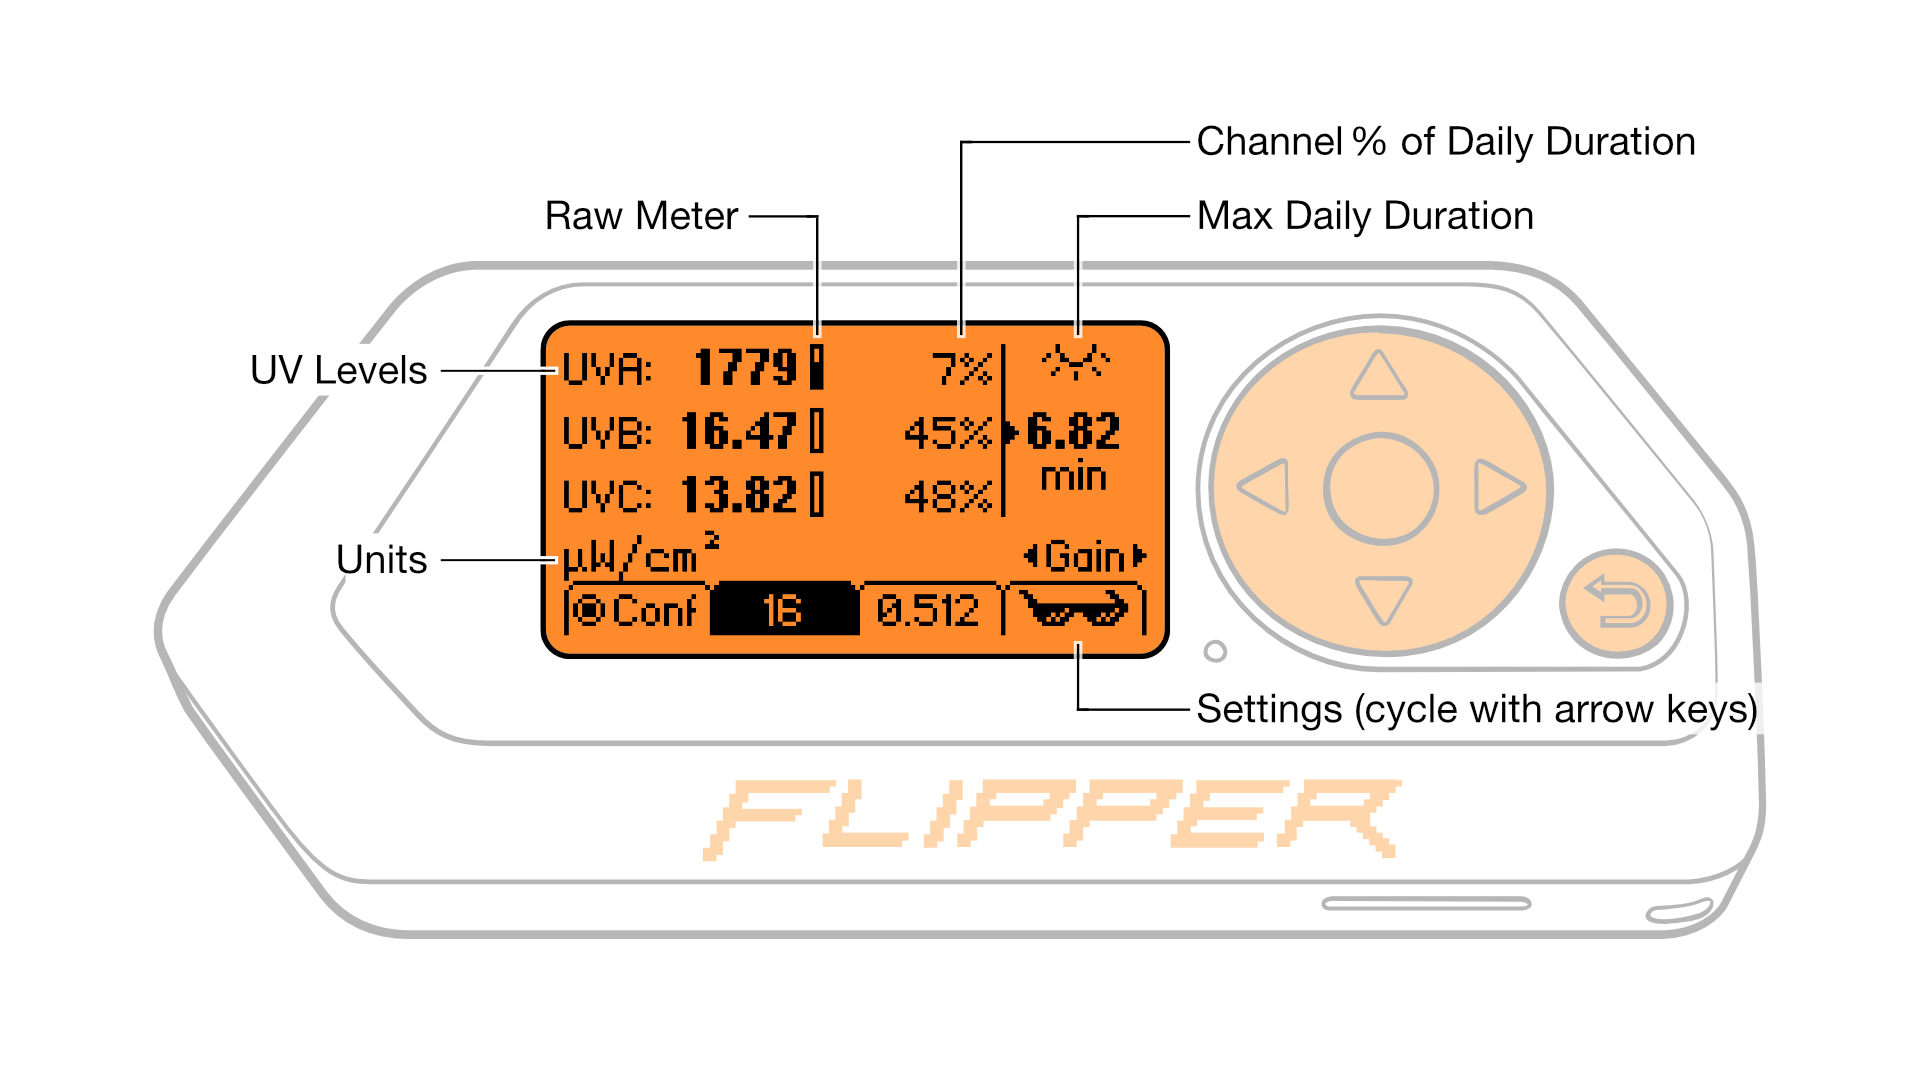
Instead of displaying the raw values as text, I envisioned a small meter next to the UV readings that shows a warning symbol when values get too high or too low. The settings are located at the bottom of the screen; you can cycle through them with the left and right keys and adjust them using the up and down keys. Rather than statically labeling each setting and occupying considerable space, the active setting’s description dynamically appears. Additionally, I thought it would be informative to indicate how each UV reading contributes to the maximum daily exposure duration. Perhaps UV-A readings are high, yet UV-B and UV-C contribute much more significantly. Lastly, let’s not forget to include the units of the UV readings.
I used an online tool to experiment with various layouts based on these ideas. Initially, the designs didn’t look too crowded — or so I thought. In my final iteration, I even bumped up the font size of the UV readings. However, after selecting “Flipper Zero” in the first dropdown, the canvas turned orange, and the aspect ratio looked plausible, so I assumed everything was fine. What I hadn’t noticed was a second dropdown meant for choosing the exact screen resolution; because I never touched it, the tool quietly kept working at 192×96 px instead of 128×64 px.
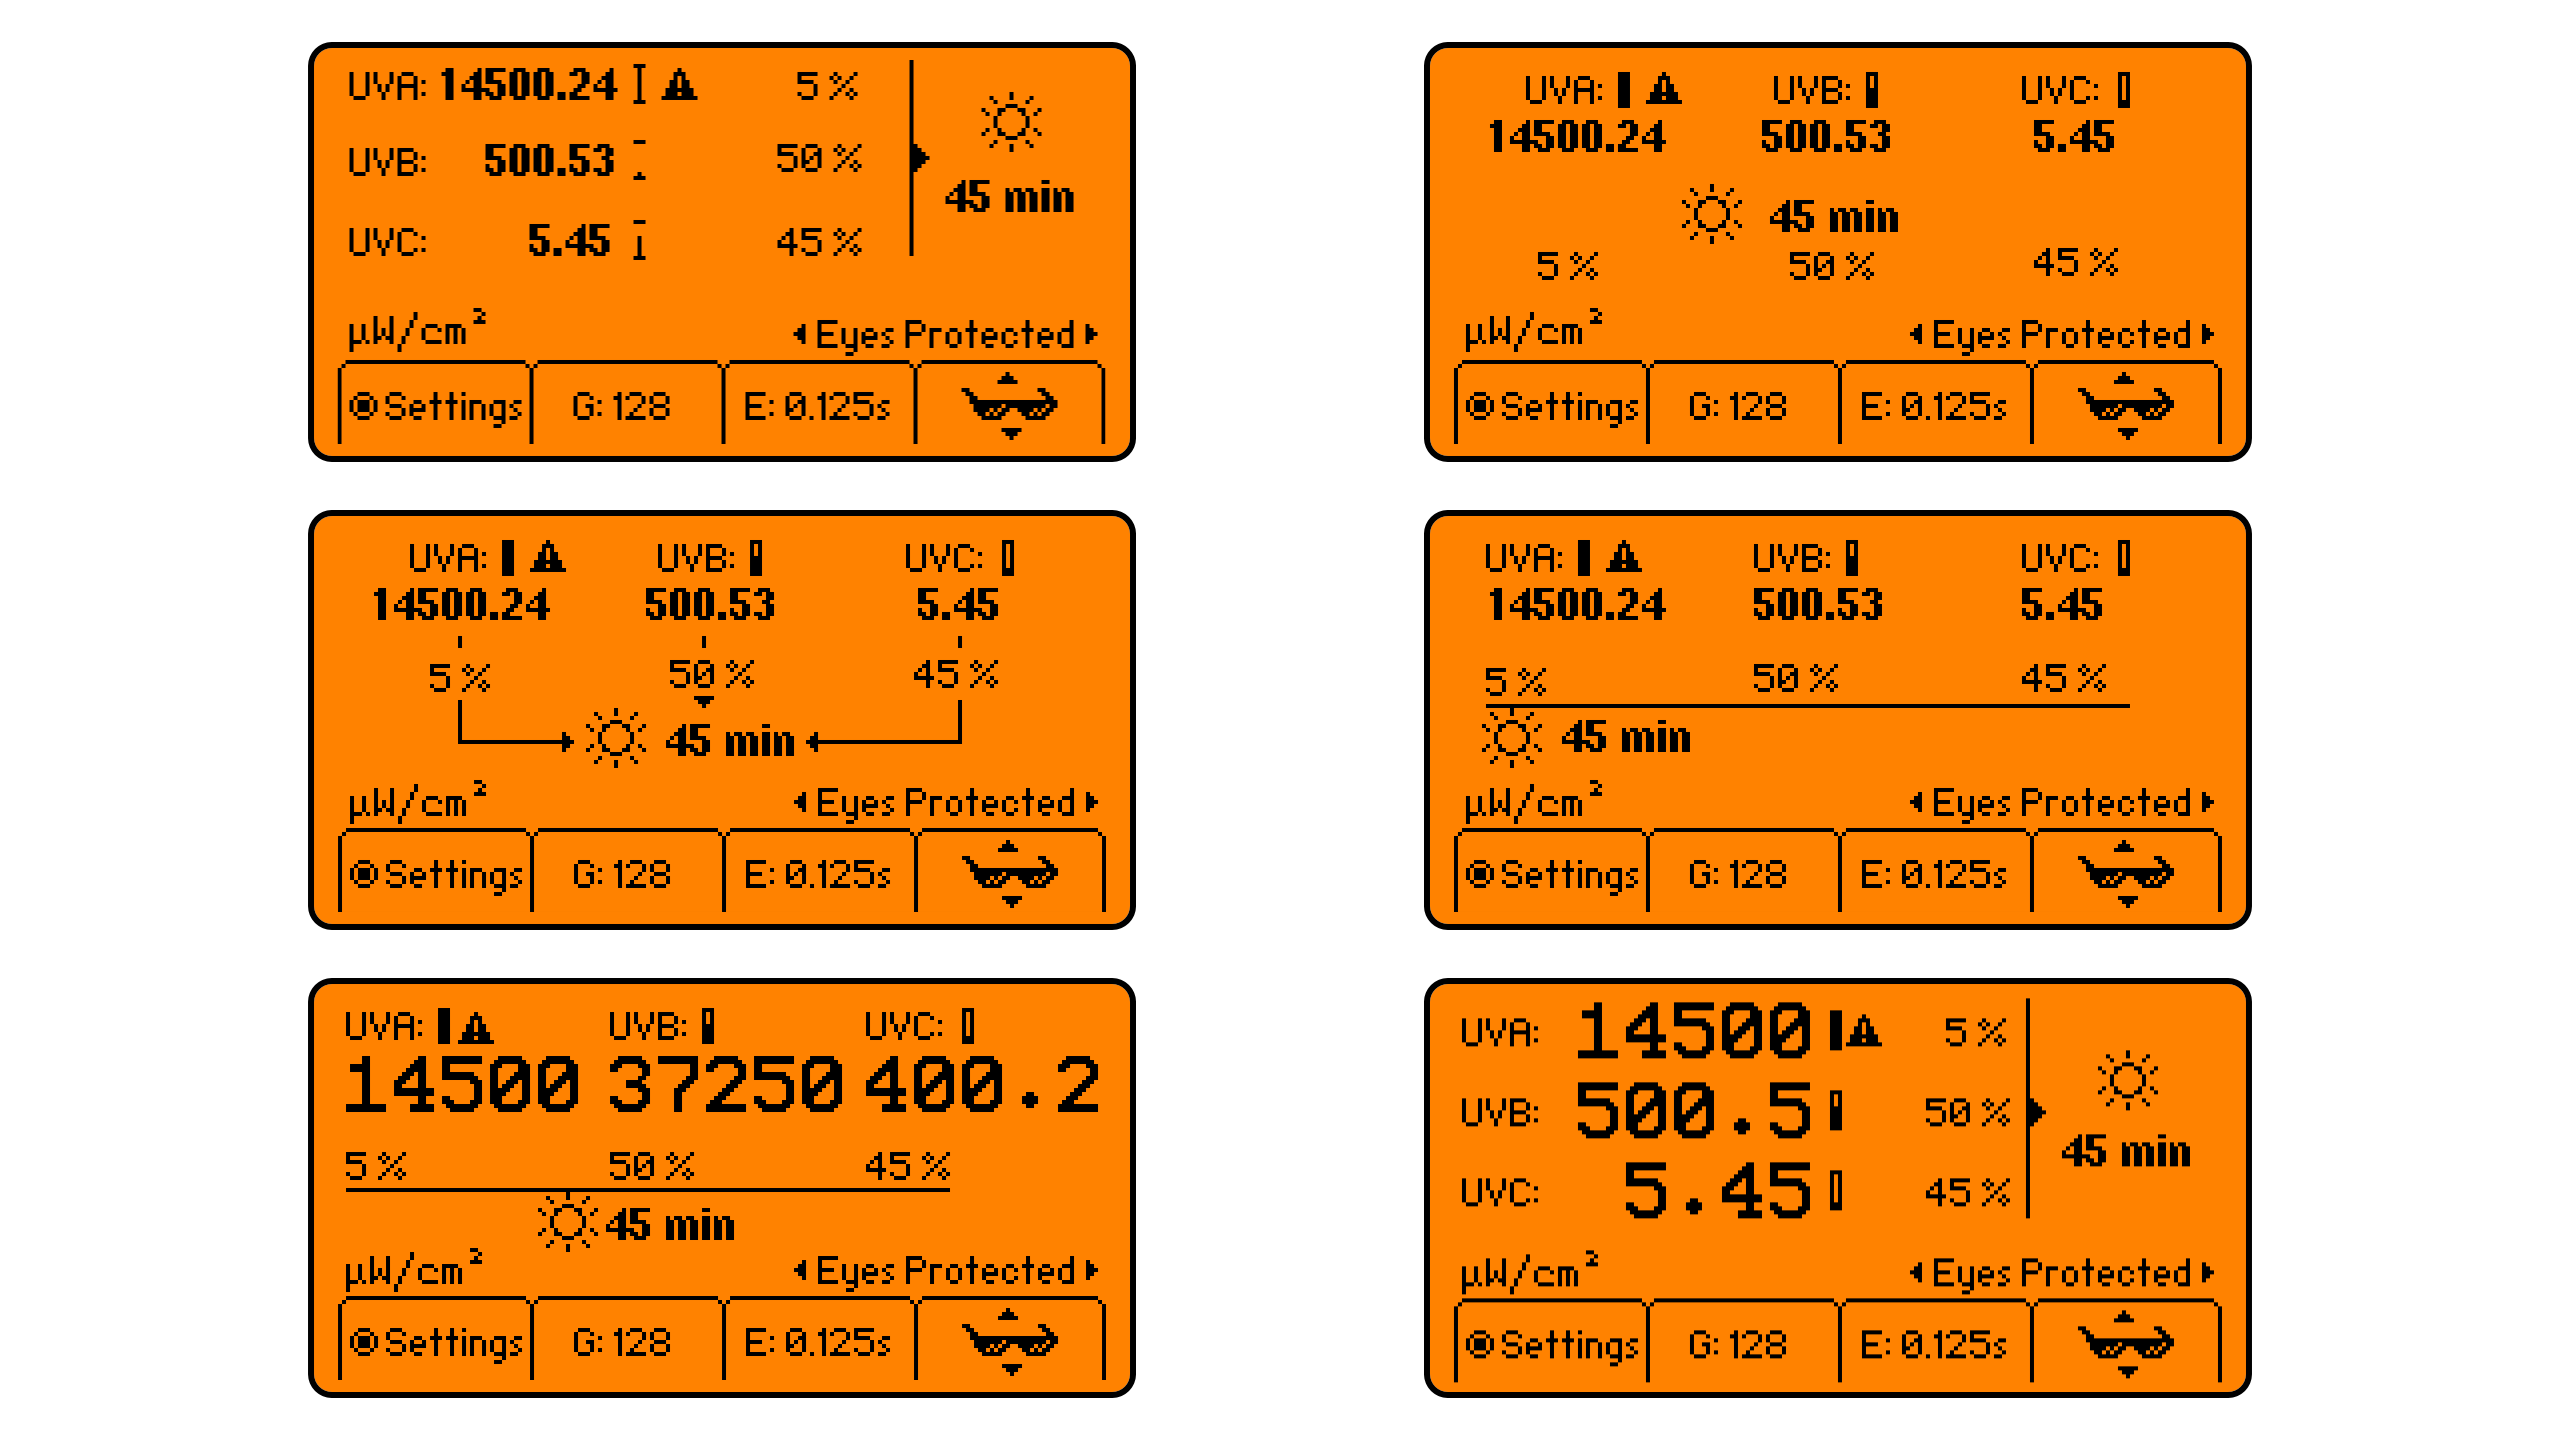
Needless to say, things got more cramped once I corrected the resolution. Despite a few compromises, I'm still quite happy with the final outcome.
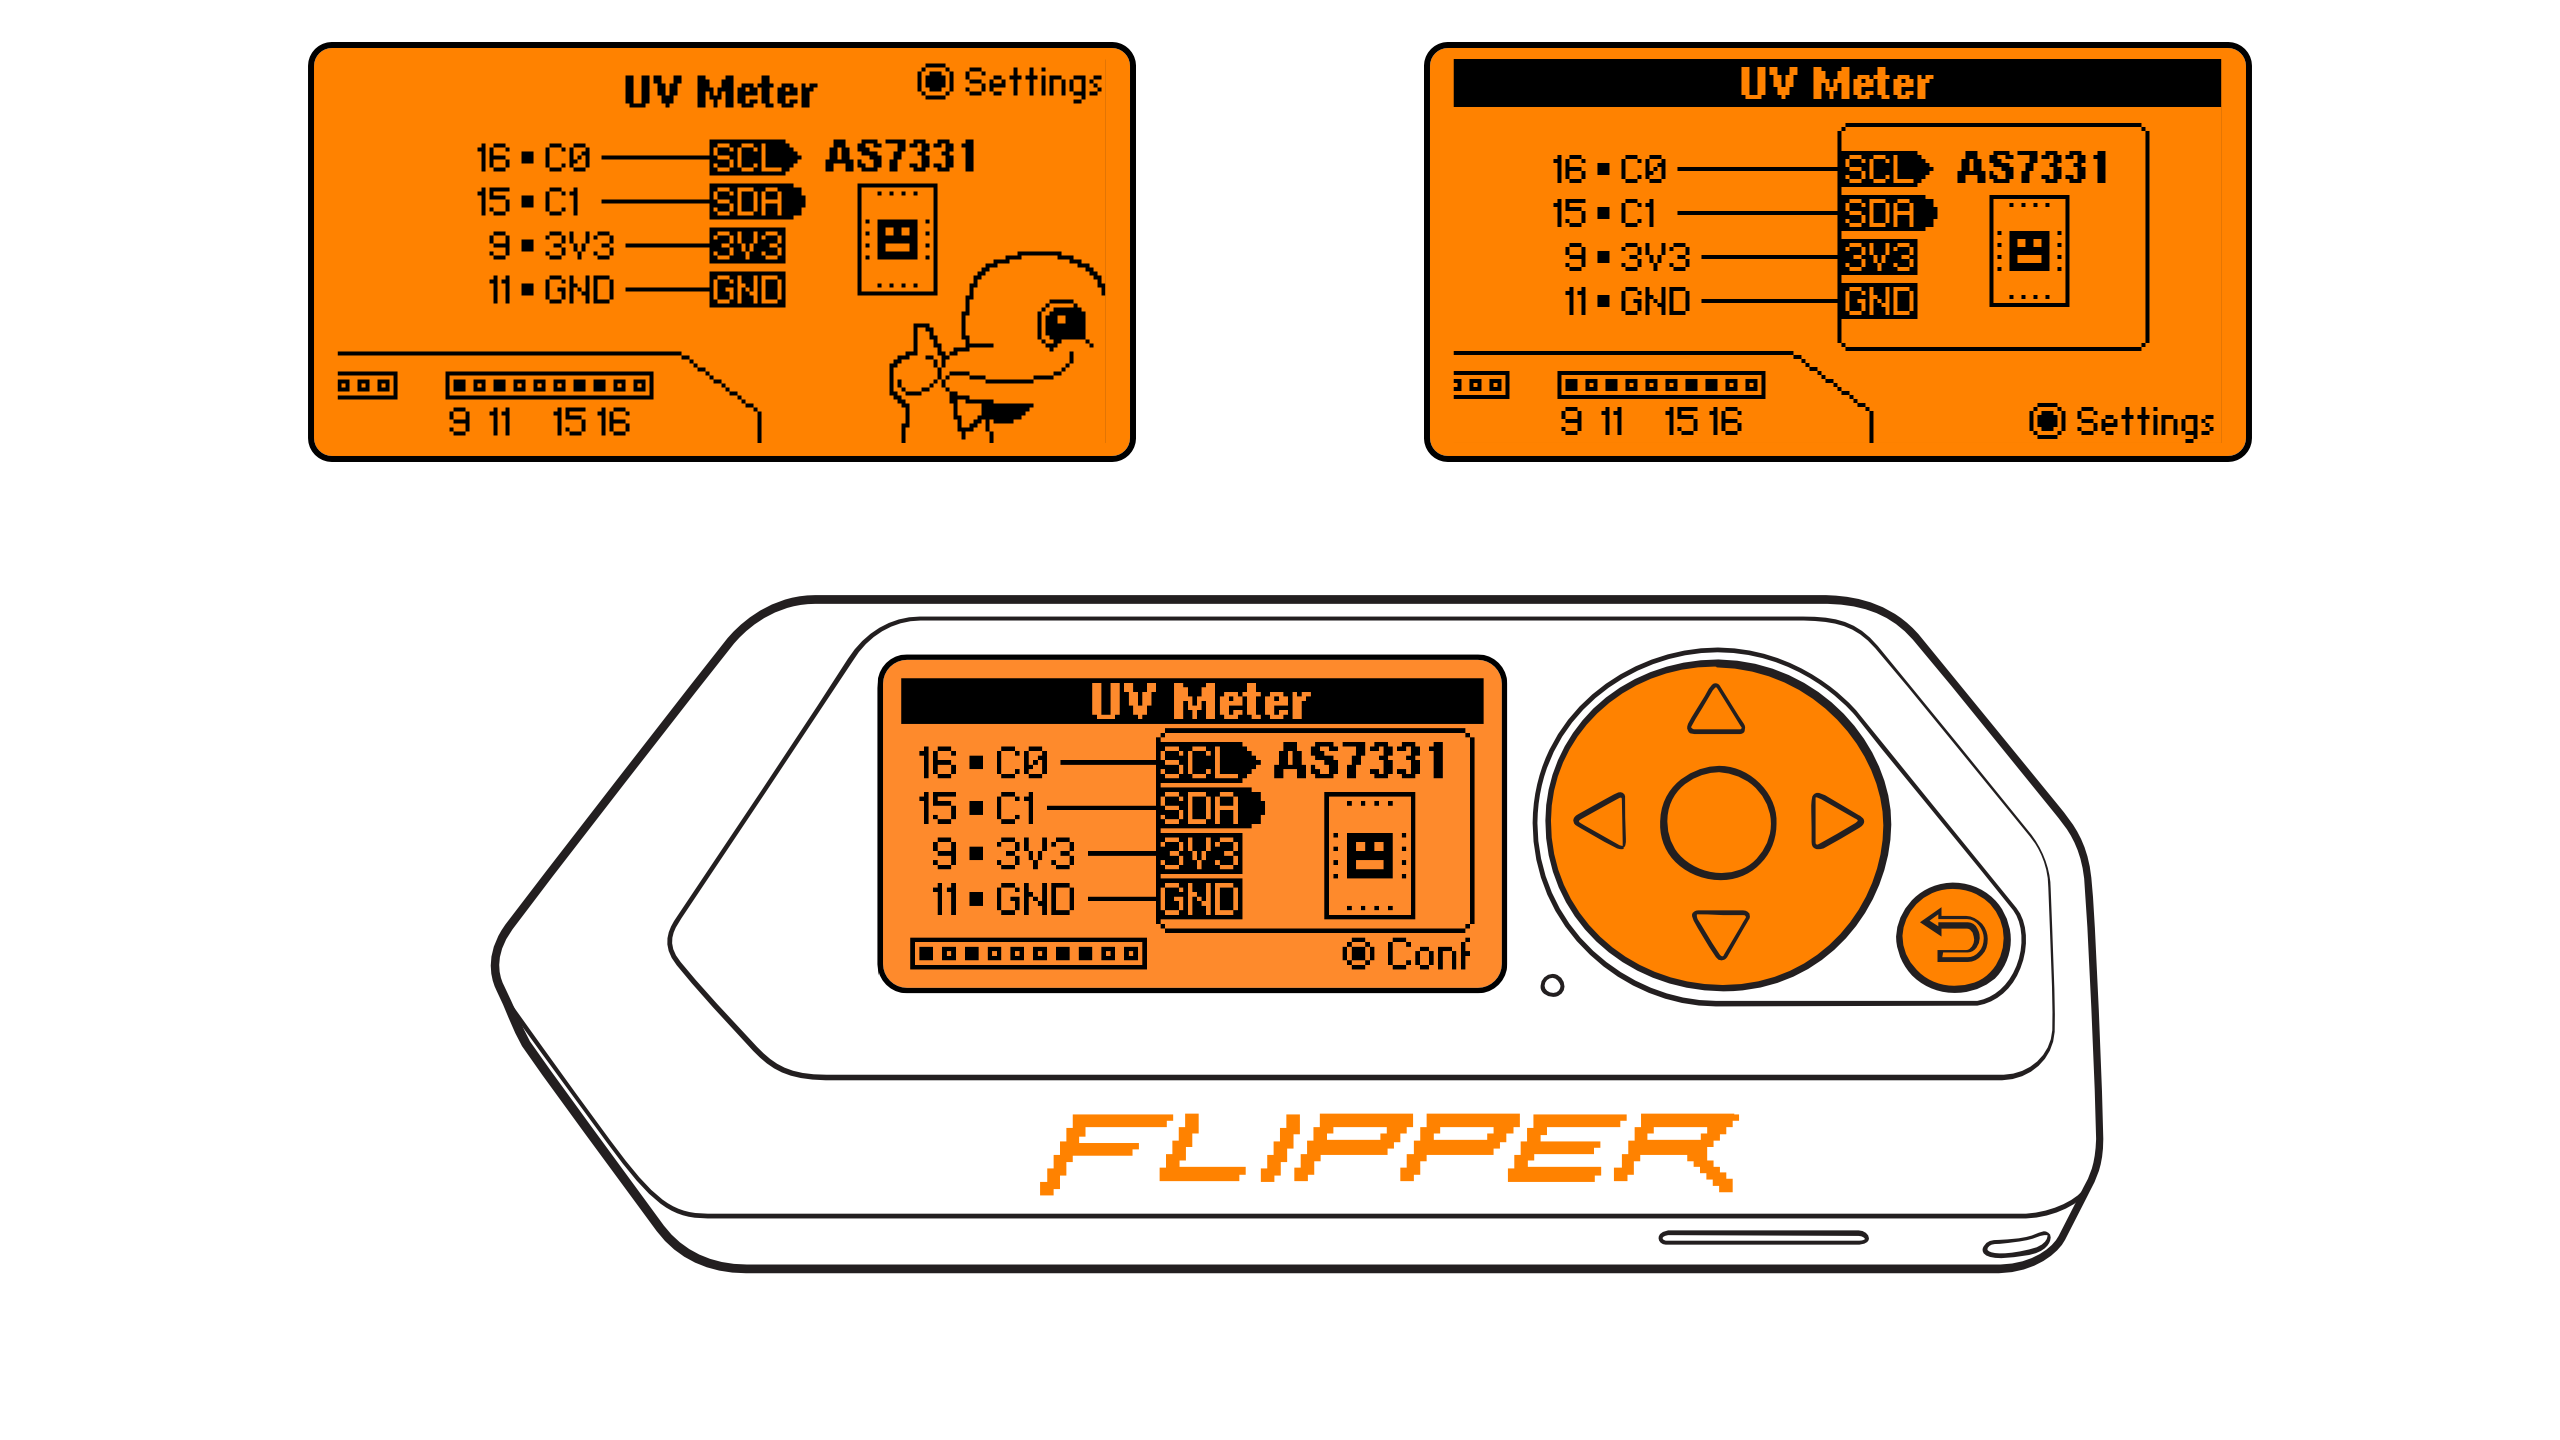
The “Wiring” screen shares a similar story. When no sensor is connected or detected, I wanted the display to show clear instructions on how to hook it up. Ideally, the user should intuitively connect the on-screen information to the real-world activity of wiring the sensor. Therefore, the list showing “number (black rectangle) and pin name” matches what you see on the Flipper’s GPIO pins. However, since this list is out of order, I also illustrated the pins’ actual positions on the Flipper. Opposite this, I placed a stylized breakout board. As of now, the SparkFun version seems the most prevalent, so I mirrored their silkscreen design and pin order. (Interestingly, the sensor actually has three distinct areas that resemble a small face.)
Polishing the Application
Designing a layout is all well and good, but it still has to be implemented. The new UI also needed a configuration menu, so I could change the I²C address, convert the readings to other common units, and add “About” and “Help” screens. That forced me to rewrite basically everything (except the AS7331 library): I had to move from a simple ViewPort application to a full‑blown SceneManager / ViewDispatcher architecture. It took some time to implement, and the documentation was scarce, but thanks to the open‑source community I was able to figure out best practices from the firmware and other applications.
Afterward, I figured out how to contribute the UV Meter application to the official Flipper App Catalog and Momentum Firmware, where it’s now available to everyone.
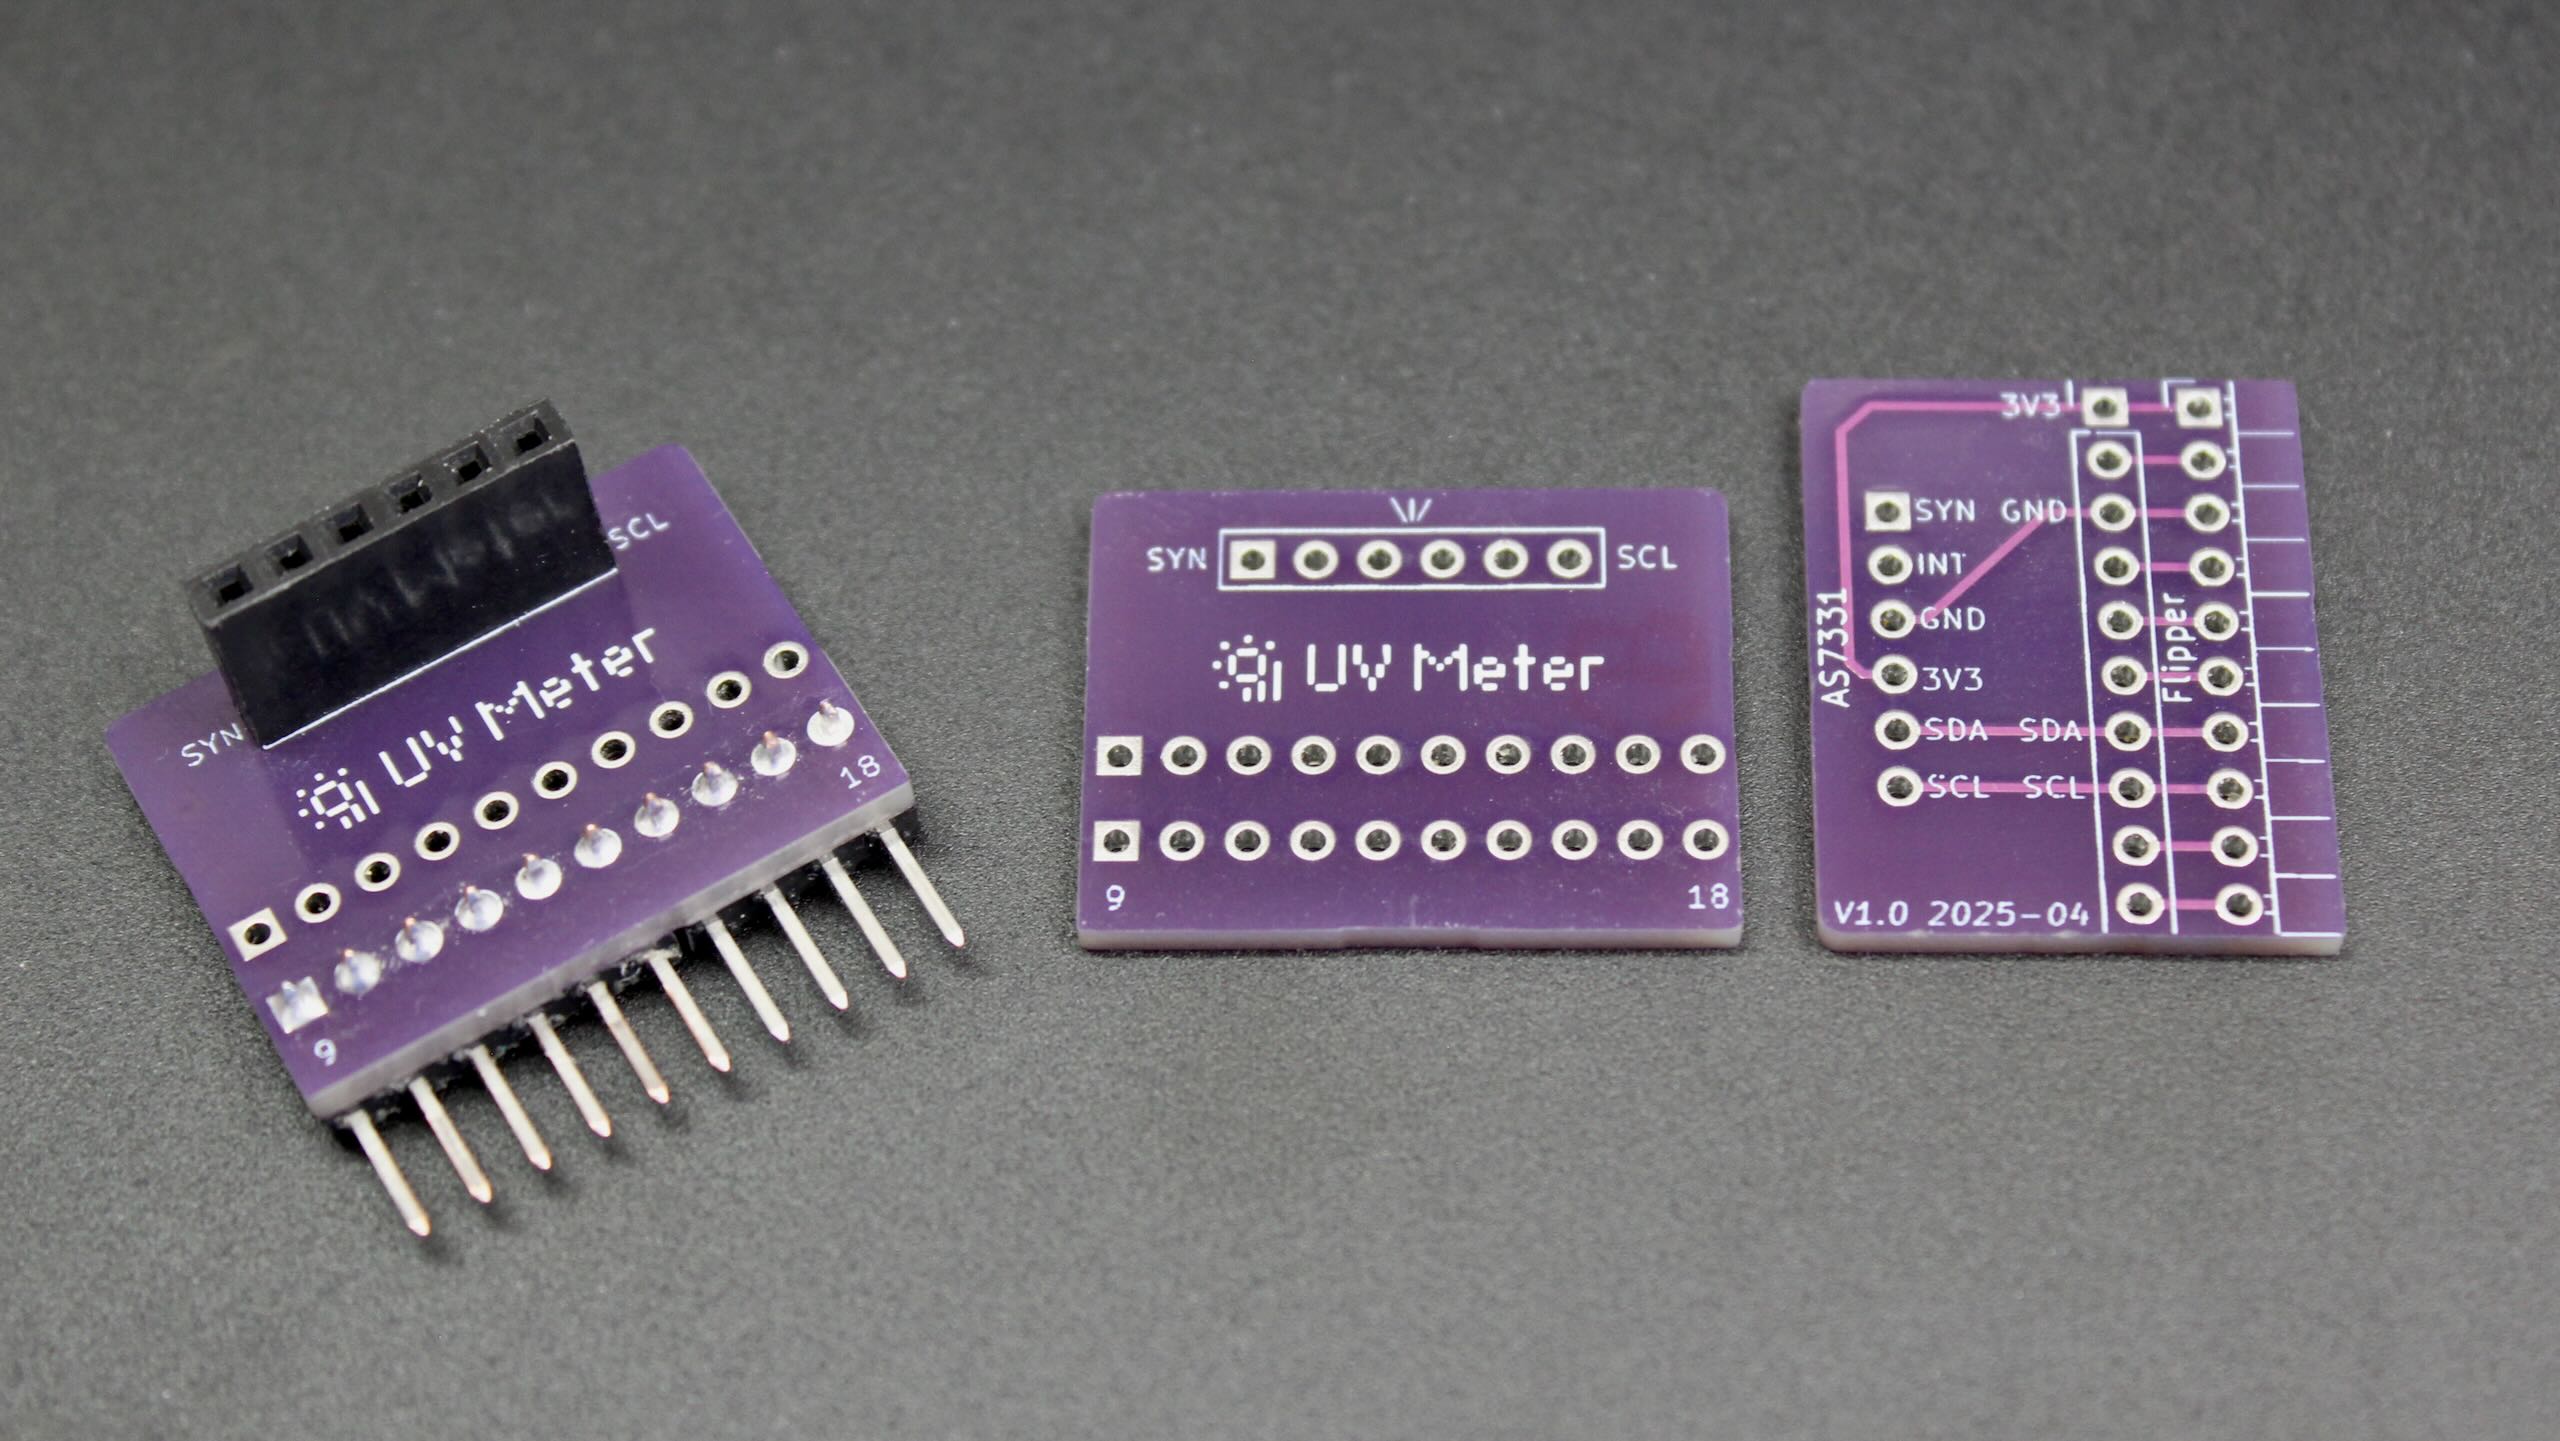
As a final touch, I designed a tiny adapter PCB in KiCad that lets me connect the breakout board to the Flipper — no more cable fiddling required. (One might even call its color dark purple ultraviolet.) The front only shows the application icon and minimal labeling to help you avoid plugging things in the wrong way. On the back, the labels show which Flipper pins connect to which sensor pins. As with everything else, the files are open source in the UV Meter GitHub repository.
Final Thoughts
Perhaps most surprising are the incredibly short “safe” daily exposure durations based on the 2024 TLVs and BEIs. Sure, being indoors behind glass, in the shade, or beneath clouds is safer than direct sunlight — but probably not as safe as you’d expect. For example, in those conditions, some of my measurements tripled the safe exposure duration, but starting from just 3 minutes, tripling still means less than 10 minutes daily. Although it’s worth remembering what the guidelines actually say about these limits:
[…] nearly all healthy workers may be repeatedly exposed without acute adverse health effects such as erythema and photokeratitis.
Meanwhile, as far as I understand, the UV Index focuses mainly on preventing sunburn.
My takeaway is that I should protect my eyes and skin more than I used to think. With that in mind, I hope this project not only sheds some nerdy light on the subject but also draws a bit more attention to it.